
Skip content
Dojo Tutor
Log inTry class

Statistics Tutoring

Personalized support from experienced teachers, with the flexibility of learning online.

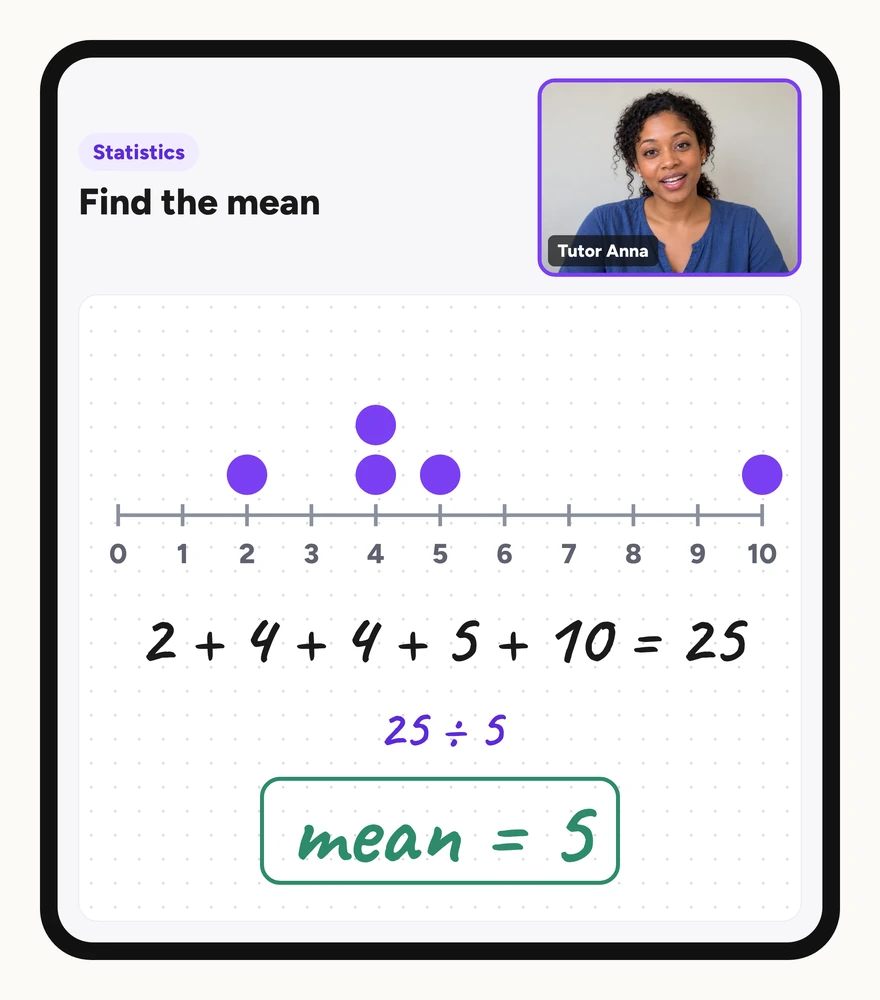
Illustration of an online statistics lesson: a tutor on video and a dot plot of five values with their mean calculated as 5.

I have seen such a boost in her grades and confidence — Jessica S

Try a class

Top Statistics Tutors

5 of 12 tutors shown · 5.0 avg rating from 2,570 reviews

Mr. Maurer or Mr. Mike!

Certified classroom teacher

Super tutor

5.0

331 ratings

9 years

Experience

5th and 6th grade

Available Tue, Wed, Thu, Fri, Sat

Can support: ADHD, Dyslexia, ESL ...

I have taught math for nine years, from 5th grade (most fun! We love fractions!) to high school. Now I teach 6th grade, and what I most like to talk…

All grades

Available Mon, Tue, Wed, Thu, Fri, Sat

Hi! My name is Emma and I'm a PhD student studying physiology. I've been teaching anatomy and physiology classes for the past few years, and have…

6th grade

Available Sun, Mon, Tue, Thu

Can support: Gifted & talented

I am a dedicated and passionate educator whose professional journey spans the full spectrum from middle school to pre-university levels. Over the…

All grades

Available Mon, Tue, Wed, Thu

Can support: ADHD, Dyslexia, ESL ...

Kids thrive when learning feels clear and possible. That’s the aim of every session here. Your child gets steady, confidence-building support shaped…

6th grade

Available Sun, Mon, Wed, Fri

I’ve been teaching for six years and specialize in Math for students in grades 6 through 12. I hold a Bachelor of Education with a focus in…

Statistics tutoring that connects data to reasoning

Statistics asks students to move between calculations, visual representations, and real-world interpretation. A sampling method can look correct until bias is examined; a median can be calculated without understanding what it represents; a probability can be computed without checking whether events are independent. Tutoring can start with the exact point where the procedure stops making sense.

Tutors can connect formulas to dot plots, two-way tables, box plots, and the questions those tools answer. Students might explain why a sample is biased, calculate quartiles and check for outliers, or distinguish conditional probability from independence. The aim is to give students a way to explain their reasoning and verify their work, alongside practicing the calculation.

Why families look for Statistics support

The calculation is correct, but the interpretation is unclear

Students may find a median or z-score without explaining what it tells us about the data. Tutors can ask what the measure represents in context, connect the number to a visual display, and check whether the interpretation matches the original question.

Sampling and probability concepts feel abstract

A sampling method or probability rule can seem disconnected from a real situation. Tutors can use concrete examples to show how bias enters a sample, why independence matters, or what a conditional probability restricts. Connecting the definition to a scenario makes the reasoning easier to check.

Where students can get stuck in Statistics

Identifying bias in a sampling method

A voluntary-response sample contains people who choose to participate, so strong opinions may be overrepresented. Tutors can examine the sampling frame, how participants are selected, nonresponse, and question wording separately. Equal selection chances alone do not establish that the responses represent the target population.

Finding the median with an even number of data points

With twenty ordered values, the median is the average of the tenth and eleventh values. Tutors can distinguish the count of observations, their positions in order, and the numerical values at those positions before calculating the average.

Calculating and interpreting quartiles

One common classroom method finds Q1 as the median of the lower half and Q3 as the median of the upper half. Conventions for odd-sized samples and software can differ, so tutors can follow the method specified by the task. The quartiles describe positions in ordered data, rather than individual data values' percentages.

Distinguishing conditional probability from joint probability

Conditional probability restricts the sample space to one row or column of a two-way table. The probability of working weekends given full-time employment uses only the full-time row, not the entire table. Students may divide by the wrong total if they do not identify what condition is given.

Confusing independence with mutually exclusive events

Two events are independent if knowing one does not change the probability of the other. They are mutually exclusive if both cannot happen together. Rolling a five and obtaining a sum of seven on two dice are not mutually exclusive because both can occur. Tutors can use examples to separate the two concepts.

How Statistics tutors make the next step clearer

Connect a measure of center to its meaning in context

The mean adds all values and divides by the count; the median is the middle value when data are ordered. Tutors can show both on a dot plot and discuss which measure better represents the data when an outlier is present. Students can then explain their choice rather than apply a formula without interpretation.

  1. Order the data and identify the middle value or values.
  2. Calculate the mean by summing all values and dividing by the count.
  3. Compare the two measures and check for outliers.
  4. Explain which measure answers the question in context.

Use a two-way table to clarify conditional probability

A two-way table organizes counts by two categories. To find the probability of event Y given event X, restrict attention to the row or column for X and divide the count of both events by the total for X. Tutors can highlight the restricted row and ask students to explain why the denominator changes.

Check for bias by examining the sampling method

Stratified random sampling selects within defined subgroups. A systematic sample uses a fixed interval after a starting point, often chosen randomly. Tutors can examine who appears in the sampling frame, how the interval relates to population patterns, who responds, and how questions are phrased, rather than use equal selection chances as the only test for bias.

Putting Statistics skills into practice

From a data set to quartiles and outlier boundaries

Using the median-of-halves convention, order 2, 4, 6, 8, 10, 12, 14, 30. Q1 is 5 and Q3 is 13, so the IQR is 8. The 1.5-IQR fences are −7 and 25; 30 lies above the upper fence and is flagged as a potential outlier. Tutors can explain the calculation and discuss the value in context before deciding what to do with it.

From a two-way table to testing independence

Use an original finite probability model: a bag contains twenty cards, twelve blue and five marked with a star; three cards are both blue and starred. P(blue) = 12/20, P(star) = 5/20, and P(both) = 3/20. Since (12/20)(5/20) = 3/20, the two events are independent for a uniform random draw from this bag. Students can connect the calculation to the overlap in a two-way table.

Inside a 25-minute session

What a Statistics tutoring session can look like

This illustrative lesson focuses on finding quartiles and identifying outliers using the interquartile range. Tutors can choose a different topic or adjust the pace to match the student's current work.

  1. 0–4 min

    Review the data and find the median

    Order a small data set and identify the median. If the count is even, average the two middle values. Check that students understand the median divides the data in half.

  2. 4–10 min

    Find the first and third quartiles

    Identify the lower half of the data and find its median to obtain Q1. Repeat for the upper half to obtain Q3. Discuss that quartiles divide the data into four equal parts, so Q1 marks the 25th percentile and Q3 marks the 75th.

  3. 10–14 min

    Calculate the interquartile range

    Subtract Q1 from Q3 to find the IQR. Explain that the IQR measures the spread of the middle half of the data and is used to identify outliers.

  4. 14–21 min

    Determine outlier boundaries

    Multiply the IQR by 1.5. Subtract that product from Q1 for the lower boundary and add it to Q3 for the upper boundary. Check whether any data values fall outside those boundaries.

  5. 21–25 min

    Interpret the results and choose next practice

    Discuss what an outlier means in the context of the data. Review the steps and choose another data set or return to quartile calculation if the process is still unclear.

Example timings only. The topic, activities, and pace can change with the student's needs.

Frequently Asked Questions

Terms of servicePrivacy PolicyNotice at Collection

© 2026 ClassDojo. All Rights Reserved.